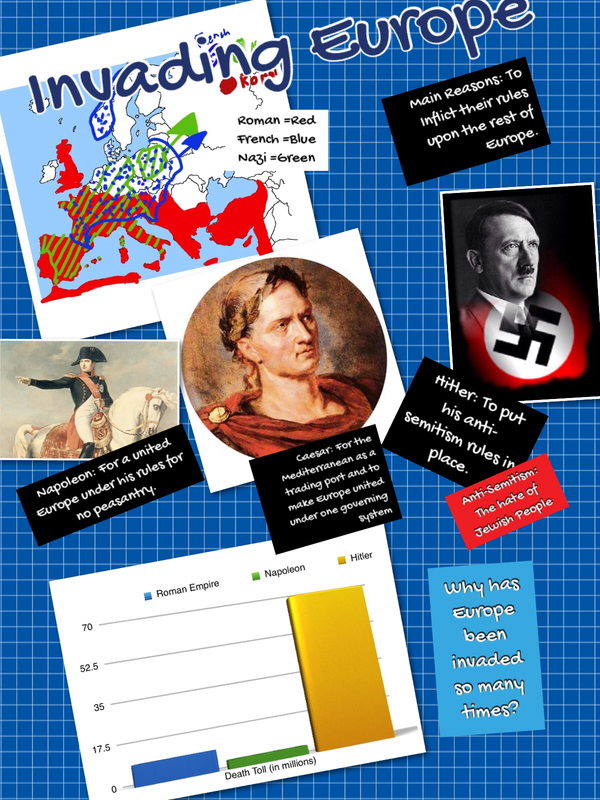
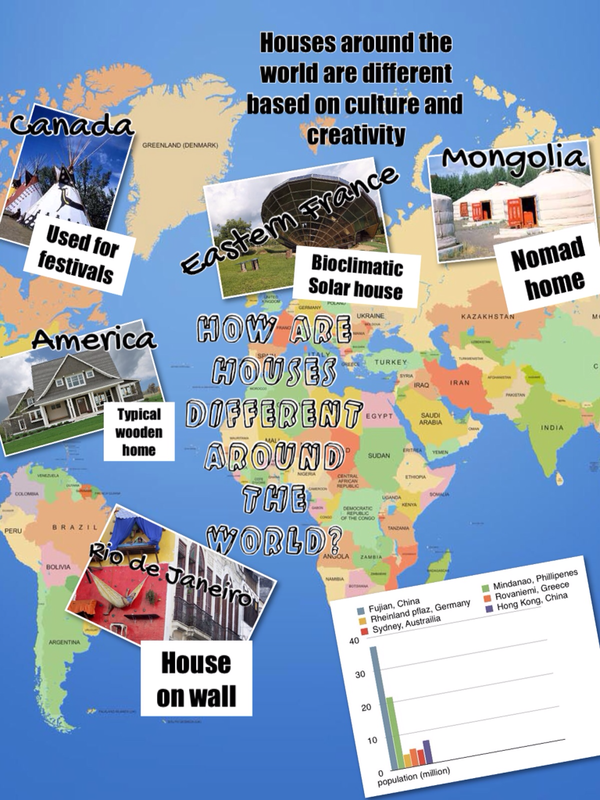
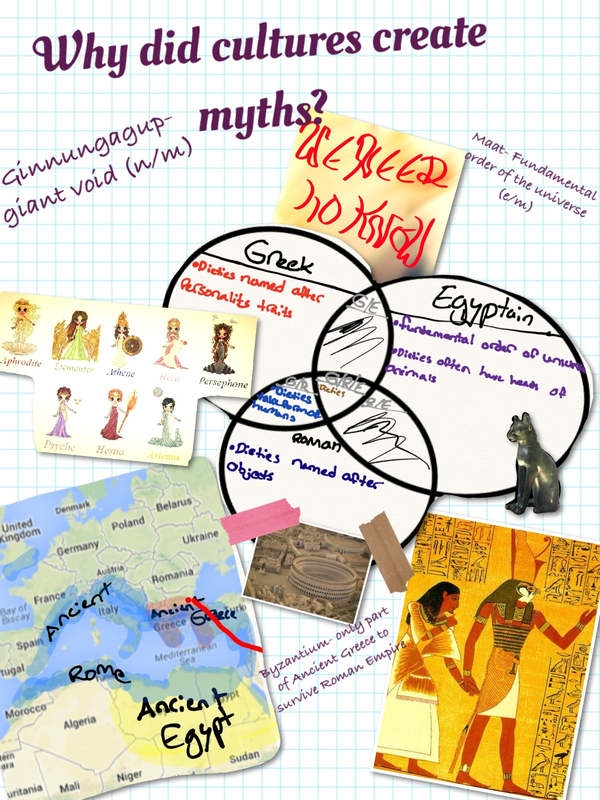
One of the products students created at the conclusion of the Geographic Inquiry was an infographic. An infographic is a visual representation of information and data. Students were required to use a map as well as a chart, graph, or graphic organizer. Check out the awesome student work samples below!


 RSS Feed